1. Introduction
African trypanosomes are protozoan parasites that cause severe diseases in human and livestock with fatal consequences unless treated. Trypanosomiasis caused by T. congolense and T. vivax is one of the most significant constraints on cattle production in Africa.
Trypanosomes are extracellular parasites that survive in the bloodstream. In cattle, anaemia is the key feature of the disease and persists after the first wave when parasite numbers have declined to low or undetectable levels. Because of the importance of the anaemia in trypanosomiasis many studies have been carried out to describe its nature and discover its causes (Noyes et al, 2009).
A mouse model may be helpful in developing understanding of the mechanisms underlying the resistance to trypanosoma. Certain strains of mice are tolerant to the disease while others are highly susceptible. Microarray experiments have been carried out on C57BL/6, BALB/c and A/J strains of mice. A large amount of data has been recorded at different time points after the infection.
2. Background
The microarray experiment results were provided for this project in the form of an interaction network (hereafter “mouse liver” network) including only those genes for which there is evidence of expression in liver. The data was provided in the form of xgmml file. The data showing the changes in gene expression between day 0 and day 7 post-infection was measured on samples from liver tissue and was provided in the form of the pvals file.
3. Aims
The aim of the project was to examine the data provided at the pathway level. A possible model was developed for the mouse response at peak parasitaemia (day 7 after infection).
4. Materials and methods
The following software was used in the project:
- Cytoscape version 2.8.2
- Network Analysis plugin
- Advanced Network Merge plugin
- jActiveModules plugin
The following data was provided:
- Mouseliver.xgmml : the interaction network file
- Abc07.pvals : the gene expression file
The data was analysed using the software listed above following the protocol by Cline et al (2007).
4.1. Network parameters
The mouse liver network was loaded into Cytoscape. The network contained 3,531 nodes and 17,195 edges (Figure 1). The network consisted of one large connected component of 2,674 nodes and 15,639 edges and 253 smaller components not connected to the large component. The smaller components range in size from 2 to 36 nodes.
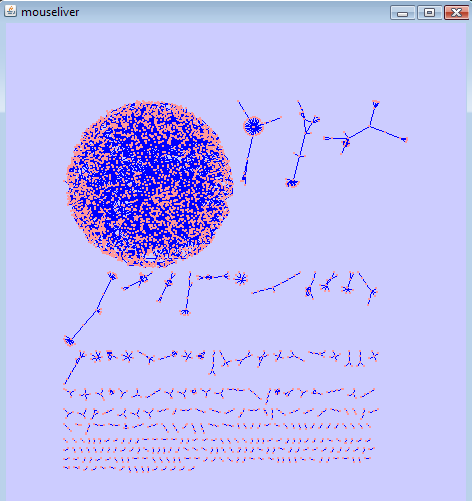
Figure 1 - Mouse liver network.
4.2. Node Degree Distribution
As expected from literature, node degree distribution in a cellular network is not random, but follows a power law (Barabasi & Oltvai, 2004). The power law was fitted as follows: y = 6578x-1.918. The power law explains 91.6% of the distribution, which is a very good fit (Figures 2, 3).

Figure 2 - Node degree distribution and power law

Figure 3 - Node degree distribution
The value of betweenness centrality is normalized and therefore lies between 0 and 1.

Figure 4 - Betweenness centrality in mouse liver network
4.3. Identifying Active Modules
Gene expression data was imported into Cytoscape from the abc07.pvals file provided. The significance values a07sig, b07sig and c07sig were used to identify active modules within the mouse liver network using the jActiveModules plugin. The plugin identified five active modules. Two first modules, containing 185 and 234 nodes, were selected for further analysis. The Advanced Network Merge plugin was used to identify the intersection between the modules. The resulting merged network contained 143 nodes, which is a high degree of intersection.
The following steps were performed for each module and for the intersection network:
- expression data was coloured by fold change in A/J mice
- ten proteins with highest log fold values were identified
- the results were presented in Tables in results section, including protein name, log fold value and whether the protein is present in module 1, module 2 and the intersection between modules
The steps were repeated for BALB/c and C57BL/6 mice strains.

Figure 5 - Active module identified in mouse liver network.
4.4. Checking against Gene Ontology
Gene ontology project provides a controlled vocabulary of terms for describing gene product characteristics and gene product annotation data. Gene Ontology for the mouse liver network was checked using the BiNGO plugin v. 2.44. The following files were downloaded from the Gene Ontology website: the full ontology file v.1.2 (gene_ontology_ext.obo) from the downloads/ontologies section and Mus musculus annotation file (gene_association) from downloads/annotations section.
- BiNGO plugin was started
- With the whole mouse liver network being active, the first of the active modules found in 4.3 was selected. This highlighted the module nodes in the mouse liver network
- The following settings were changed from default in BiNGO settings screen:
- Select reference set: “Use Network as Reference set”
- Select ontology file: gene_ontology_ext.obo
- Select organism/annotation: gene_association
- Significance level: 0.01
- BiNGO analysis was performed
- BiNGO output in the form of the data panel and the graph was analysed and the results were investigated in the attempt to identify the gene categories that were over-represented.
The steps above were repeated for the second active module.
Two categories were identified as over-represented for further analysis. The genes annotated with these categories were selected from the original mouse liver network into new networks. Each of these networks was then analysed to find the intersection between the over-represented category and the active modules identified in 4.3.
5. Results
The output from the BiNGO plugin was analysed and the genes with the highest log fold values on day 7 were presented in the tables below, broken down for mouse strains and indicating if the gene is present in module 1, module 2 and the intersection network.
| Gene | a07exp | Module 1 | Module 2 | Intersection |
| Ubd | 5.9678954 | 1 | 1 | X |
| Gbp2 | 5.7735786 | 2 | 2 | X |
| Ccl8 | 5.7155864 | 3 | ||
| Gbp1 | 5.445365 | 3 | 4 | X |
| Lgals3 | 5.4172534 | 4 | 5 | X |
| Serpina3g | 5.362374 | 5 | 6 | X |
| Ccl6 | 5.1455947 | 6 | 7 | X |
| Marco | 5.030731 | 7 | 8 | X |
| Fpr2 | 4.822051 | 8 | ||
| Mmp13 | 4.6918998 | 9 | ||
| Cxcl9 | 4.5458629 | 9 | 10 | X |
| Gzmb | 4.5131922 | 10 | 11 | X |
Figure 6 - Genes with highest log fold values in A/J strain, day 7
| Gene | b07exp | Module 1 | Module 2 | Intersection |
| Serpina3g | 6.76103175 | 1 | 1 | X |
| Gbp2 | 5.82087485 | 2 | 2 | X |
| Gbp1 | 5.7275038 | 3 | 3 | X |
| Fpr2 | 4.94588325 | 4 | ||
| Lgals3 | 4.90982775 | 5 | 4 | X |
| Cd74 | 4.78939395 | 6 | 5 | X |
| Ly6a | 4.7619165 | 7 | 6 | X |
| Ccl8 | 4.62952825 | 7 | ||
| H2-Aa | 4.624156175 | 8 | 8 | X |
| Fcgr4 | 4.5432714 | 9 | 9 | X |
| H2-Eb1 | 4.4276222 | 10 | 10 | X |
Figure 7 - Genes with highest log fold values in BALB/c strain, day 7
| Gene | c07exp | Module 1 | Module 2 | Intersection |
| Ubd | 6.4093402 | 1 | 1 | X |
| Gbp2 | 6.2236 | 2 | 2 | X |
| Serpina3g | 5.1775226 | 3 | 3 | X |
| Cxcl9 | 5.0992863 | 4 | 4 | X |
| Cxcl10 | 4.7095646 | 5 | 5 | X |
| Lgals3 | 4.6491436 | 6 | 6 | X |
| Gbp1 | 4.2545664 | 7 | 7 | X |
| Igj | 4.2137042 | 8 | ||
| Fpr2 | 4.1394768 | 8 | ||
| Gzmb | 3.7592078 | 9 | 9 | X |
| Vim | 3.7421474 | 10 | 10 | X |
Figure 8 - Genes with highest log fold values in C57BL/6 strain, day 7
Graphical output from BiNGO was analysed visually. The yellow and orange nodes represent gene ontology categories that are overrepresented at the significance level. Uncoloured nodes are not overrepresented themselves, but they are parents of overrepresented nodes further down. Some nodes could be immediately identified as most relevant – there were most intensely coloured and were located away from the centre of the network. Nodes with GO-ID 6954 (inflammatory response) and 9611 (response to wounding) were selected as relevant.

Figure 9 - BiNGO output for active module 1 and nodes with GO-ID 6954, 9611
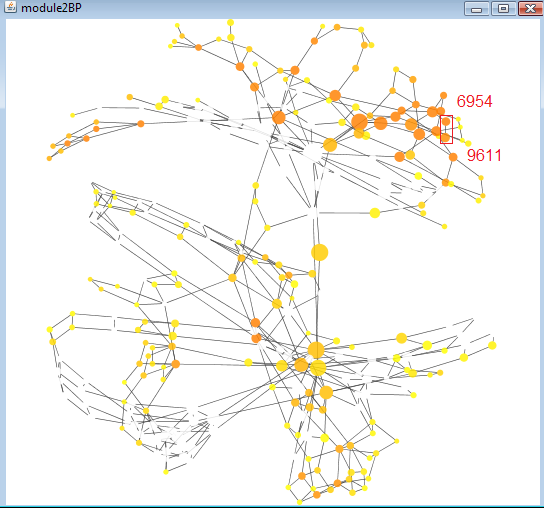
Figure 10- BiNGO output for active module 2 and nodes with GO-ID 6954, 9611
Next, genes annotated as “inflammatory response” and genes annotated as “response to wounding” were selected as new networks.

Figure 11 - Genes annotated as 'inflammatory response' (GO-ID 6954)

Figure 12 - Genes annotated as 'response to wounding' (GO-ID 9611)
Finally, the intersection of the annotated genes and the active modules was analysed.

Figure 13 - Genes annotated as 'inflammatory response' (GO-ID 6954) in active module 1

Figure 14- Genes annotated as 'response to wounding' (GO-ID 9611) in active module 1

Figure 15 - Genes annotated as 'inflammatory response' (GO-ID 6954) in active module 2
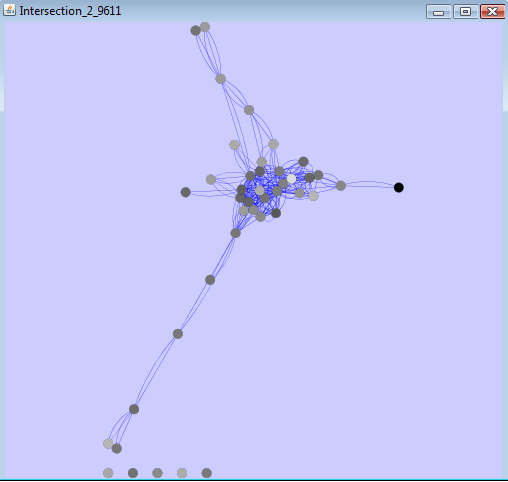
Figure 16 - Genes annotated as 'response to wounding' (GO-ID 9611) in active module 2
6. Discussion
Scientists have studied a mouse model of tolerance to trypanosomiasis. C57BL/6 mice survive for a relatively long period after infection with T. congolense (110 days), strains such as A/J (16 days) or BALB/c (49 days) are relatively susceptible (Goodhead et al., 2010).
Hanotter et al (2003) aimed to identify Quantitative Trait Loci (QTL) that control resistance to trypanosomiasis in cattle. They made an experimental cross between trypanotolerant African N'Dama (Bos taurus) and tryptanosusceptible Kenya Boran (Bos indicus). They genotyped 177 animals and their parents and grandparents at 477 molecular marker loci covering all autosomes, covering 82% of the genome. The analysis supported a multilocus model for the inheritance of trypanotolerance and ten QTL were identified as contributing to disease tolerance. The location and structure of the QTL regions was determined by using public Single Nucleotide Polymorphisms (SNP) and identifying where the SNPs correlated with survival time in species.
Kemp et al (1997) genotyped crosses between resistant and susceptible mouse breeds and identified the loci on the chromosomes that had a significant effect on survival time. They identified three major QTL that determined the outcome of trypanosome infection in mice and called them Tir1, Tir2 and Tir3.
Fisher et al (2007) suggested the workflows that combine Microarray and QTL data to search for candidate genes responsible for phenotypic variation. The workflows were applied to the case of resistance to trypanosomiasis in the mouse. An initial list of 344 genes identified in the Tir1 QTL region has been narrowed down to 32 candidate genes. Further, MapK signalling pathway was identified as containing a high proportion of genes that show differential expression. Daxx showed the strongest signal of differential expression and was chosen as the primary candidate.
Goodhead et al (2010) applied a series of analyses to existing datasets and combined them with novel sequencing and other genetic data to create short lists of genes that share polymorphisms across susceptible mouse breeds. They reduced the initial long list of genes within the QTL regions to a short list of candidate genes with defined genetic differences that correlate with phenotype. Pram1 regulates oxidative stress in neutrophils and Rgl2 is involved in Ras signalling which can regulate inflammation. Pram1 has the best understood functionality and Rgl2 is also a plausible candidate. Probably damaging polymorphisms were identified in Srp72 and Thsd7b but little is known of their functions making interpretation hard. Ptprc and Soat1 had probably damaging polymorphisms. Cd244 is differentially expressed and has a haplotype that correlates with phenotype in the four strains tested.
Goodhead et al (2010) identified Pram1 as the most plausible candidate gene in Tir1. They also identified Cd244 as a strong candidate gene in the Tir3 QTL. Pram1 has several GO annotations, which are “lipid binding”, “regulation of neutrophil degranulation” and “integrin-mediated signalling pathway”. Cd244 is annotated as “natural killer cell receptor 2B4”.
Pram1 is an intracellular adaptor that is critical for select integrin functions in neutrophils, which are critical for host defence against pathogens (Clemens et al, 2004). From the comparison of the log fold changes for Pram1 in three strains it can be noticed that the value for C57BL/6 is almost three times greater than for A/J and 48 times greater than for BALB/c. However, the absolute value of log fold for Pram1 is not outstanding compared to other genes. This suggests that it is not the absolute value of the log fold that is important, but the difference in the log folds for the same gene across three mouse strains. Pram1 was not picked up as part of the active module by the jActiveModules plugin. Consequently, Pram1 could not appear in the output of the BiNGO plugin, suggesting that the technique used may not be optimal for identifying the genes responsible for disease resistance.
Cd244 is expressed on all Natural Killer cells in mice. It mainly acts as an inhibitory receptor and this function plays a role in maintaining tolerance of Natural Killer cells to self cells (Vaidyaa & Mathew, 2006). Cd244 was identified by the jActiveModules plugin as part of active module 2. It should be noted that for this gene the log fold values is lower in the tolerant C57BL/6 strain compared to two other strains. However, the GO annotation for Cd244 did not appear in the output of the BiNGO plugin. The likely explanation is that it was not picked up by the plugin due to low significance values.
| Gene | a07exp | a07sig | b07exp | b07sig | c07exp | c07sig |
| Pram1 | 0.129875 | 0.644749889 | 0.00729335 | 0.978568283 | 0.3465516 | 0.232430853 |
| Cd244 | 2.020997 | 9.93E-7 | 1.2643455 | 1.81269E-4 | 0.6374838 | 0.382130858 |
Figure 17 - Significance and expression values for Pram1 and Cd244
Fisher et al (2007) identified an amino acid deletion in the Daxx gene in susceptible mouse strains and proposed Daxx as a candidate gene in the Tir1 Q TL region. Daxx is annotated as “Death domain-associated protein 6”. Daxx accumulates in both the nucleus and the cytoplasm and has been reported to interact with various proteins involved in cell death regulation. Its precise role in cell death is only partially understood despite a number of studies on the subject (Salomoni & Khelifi, 2006). Daxx was also not identified by jActiveModules as part of the active module in the mouse liver network.
7. Conclusion
This document describes an attempt to build a model for the mouse response to the infection by Trypanosoma congolense. A large amount of data from microarray experiments is loaded as an interaction network into Cytoscape and then analysed using the jActiveModules and BiNGO plugins. The use of the protocol described in this document allows suggesting several candidate genes but the results are not supported by literature and previous research.
The BiNGO plugin allows to determine which Gene Ontology terms are overrepresented in the set of genes (Maere, Heymans and Kuiper, 2005). It provides the output both as a data table and a visual graph. The visual graph, however, is subject to interpretation and it is hard to determine which nodes in the graph are of the most interest. Maere, Heymans and Kuiper (2005) note that interpretation can be difficult if a whole branch of the GO hierarchy is highlighted as being significantly overrepresented, which is very likely due to the interdependency of functional categories. It should be added that in more complex networks, even when the least significant nodes are not considered, multiple branches may be highlighted as being overrepresented, further complicating the visual analysis.
Additionally, identifying the nodes of interest only gives a reference to a GO category, which may include a large number of genes. If the goal is to reduce the amount of candidate genes to a number under ten, identifying the overrepresented category would only be one of the first steps.
While BiNGO is a tool that is flexible and easy to use, its application to the identification of the genes that play a key role in the resistance to a disease is only part of a high-level analysis. Other techniques and workflows will be needed that can use the BiNGO output and use it to further refine the list of candidate genes.
8. References
A-L Barabasi, Z. Oltvai, Network biology: Understanding the cell's functional organization, Nature Reviews Genetics, 5:101 (2004)
R. Clemens, S. Newbrough, E. Chung, S. Gheith, A. Singer et al, PRAM-1 Is Required for Optimal Integrin-Dependent Neutrophil Function, Molecular and cellular biology, 24:10923 (2004)
M. Cline, M. Smoot, E. Cerami, A. Kuchinsky, N. Landys et al., Integration of biological networks and gene expression data using Cytoscape, Nature protocols 2:2366 (2007)
P. Fisher, C. Hedeler, K. Wolstencroft, H. Hulme, H. Noyes et al, A systematic strategy for large-scale analysis of genotype–phenotype correlations: identification of candidate genes involved in African trypanosomiasis, Nucleic Acids Research, 35:5625 (2007)
Gene Ontology website, accessed on 07/01/2012
I.Goodhead, A. Archibald, P. Amwayi, A. Brass, J. Gibson et al, A Comprehensive Genetic Analysis of Candidate Genes Regulating Response to Trypanosoma congolense Infection in Mice, PLoS Neglected Tropical Diseases 4(11): e880 (2010)
O. Hanotte, Y. Ronin, M. Agaba, P. Nilsson, A. Gelhaus et al, Mapping of quantitative trait loci controlling trypanotolerance in a cross of tolerant West African N'Dama and susceptible East African Boran cattle, Proceedings of the National Academy of Sciences of the United States of America, 100:7443 (2003)
S. Kemp, F. Iraqi, A. Darvasi, M. Soller and A. Teale, Localization of genes controlling resistance to trypanosomiasis in mice, Nature genetics, 16:194 (1997)
S. Maere, K. Heymans and M. Kuiper, BiNGO: a Cytoscape plugin to assess overrepresentation of Gene Ontology categories in Biological Networks, Bioinformatics Applications, 21:3448 (2005)
H. Noyes, M. Alimohammadian, M. Agaba, A. Brass, H. Fuchs et al., Mechanisms Controlling Anaemia in Trypanosoma congolense Infected Mice, PLoS ONE 4(4): e5170 (2009).
P. Salomoni, A. Khelifi, Daxx: death or survival protein?, Trends in cell biology, 16:97 (2006)
S. Vaidyaa, P. Mathew, Of mice and men: Different functions of the murine and human 2B4 (CD244) receptor on NK cells, Immunology letters 2:180 (2006)
Feedback from the Tutor
The aims are rather too broad; you could focus more specifically on the strain differences. The overall strategy is clear and sensible, but each figure needs a full legend giving the colour scheme used. You have provided a full discussion, but it is organised as 'literature and then my results'. In a report of this type you need to discuss your own results, and then consider whether there is supporting evidence from the literature. List the references with surname first.
by Evgeny. Also posted on my website